Adrian Field

Using Fractions With Worksheets

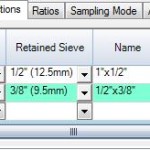
In StonemontQC, a fraction represents the material retained on multiple adjacent individual sieves. For example, material passing the 1” (25 mm) sieve and retained on the ½” (12.5 mm) sieve can be defined as a fraction (Figure 1). Note that in this example the ¾” sieve would have been included in the gradation test and

Concrete Break Schedule Tool

The StonemontQC concrete break schedule tool and report have the ability to search for and display a list of concrete specimens that need to be tested.  These specimens could be cylinders, cubes, or beams.  Searches may include any or all plants available to the user.  Searching for tests that may have been missed, tests that

How well are your mixes performing? Which mixes are performing well and which ones are liabilities?  The only way to know for sure is by the timely and effective evaluation of the data you receive.  Some data can be near real-time, like batch weights and plastic properties, but other data like strength results will have

Union Pacific Railroad (UPRR) requires that producers submit gradation results for Ballast material.  Other quality test results may be required as well but currently those results are simply submitted via email by the producer.  The latest StonemontQC patch includes support for the UPRR gradation submittal. StonemontQC treats UPRR submittals similar to DOT submittals and it

Importing Tonnage Data

StonemontQC provides the ability to hand-enter tonnage data for individual products or plants.  However, that is a time consuming process.  A better approach is to import that data, not only for a single product but all products at multiple plants.  We provide that capability via two mechanisms; manual import using a simple spreadsheet; automated import

Auto-reports are automatically generated hourly, daily, weekly, monthly, or quarterly and optionally emailed to a group of individuals such as sales, production, and quality control personnel or customers.  Auto-reports are available for the enterprise or hosted editions of StonemontQC.  Previously, auto-reports had to be viewed from within StonemontQC or automatically emailed to individuals. However, if

Depending on how you or your company is running StonemontQC, it can be time consuming to find the folder to which you want to save reports and charts that you are trying to export.  Typically, StonemontQC will use your My Documents folder as your default report folder, which for many users of the desktop edition

When things are going well, concrete is breaking beyond design strength, concrete finish times are ideal, hardened concrete exhibits little to no cracking, and discoloration is simply unheard of.  It is easy to become complacent when things are going well!  This sense of security has a way of getting shattered as business expands into new

Low Concrete Cylinder Strength Analysis

ACI defines required average compressive strength (fc’r) as the larger of the following equations:     fc’r = fc’ + 1.34 x S fc’r = fc’ + 2.33 x S – 500 (<= 5000psi) fc’r = 0.9 x fc’ + 2.33 x S (> 5000psi) Where: fc’ is design or specified strength S is the sample

Control Charts

Introduction   Control charts are a very important tool in quality control.  We say “A picture is worth a thousand words” because images are better at conveying complex ideas and most people find it easier to understand large amounts of data visually than in tabular form.  Variability in a manufactured product is unavoidable, but it